Objective
To find out which creative is more interactive with users.
Purpose
To check and find out the best interactive creative.
Features Covered
- Campaign Reports
Platform
- Desktop
- Mobile Browser (mLite)
- Apps
Summary with Screenshots
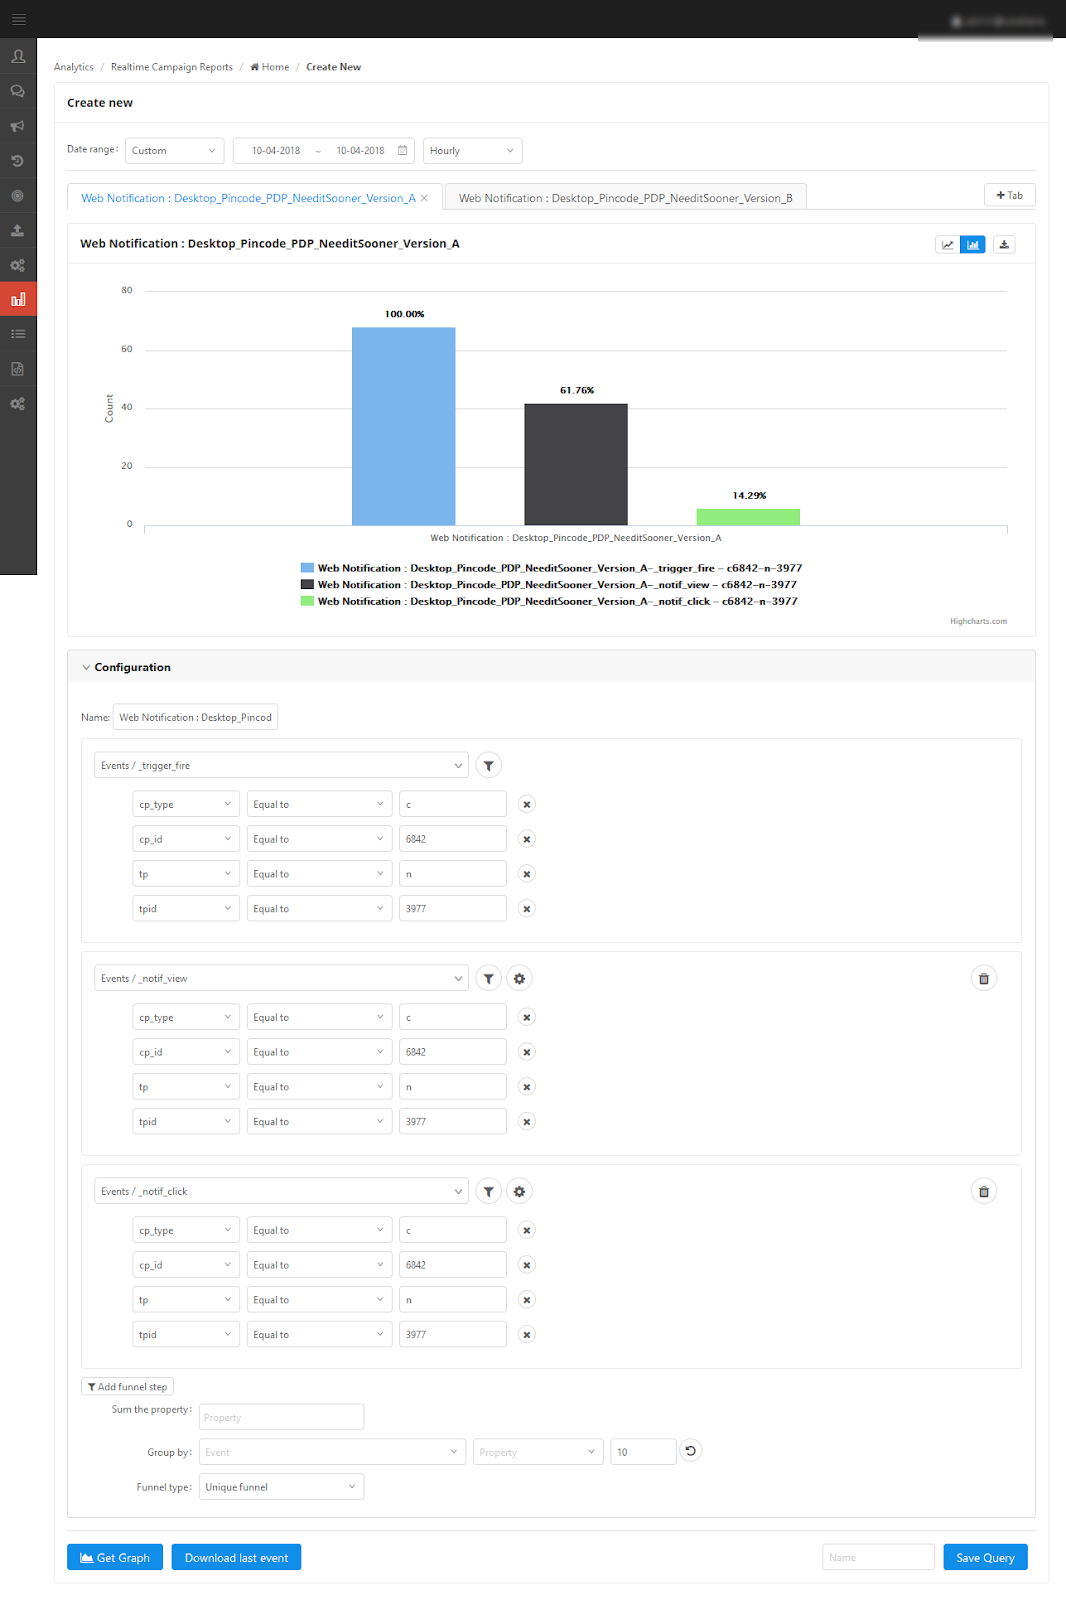
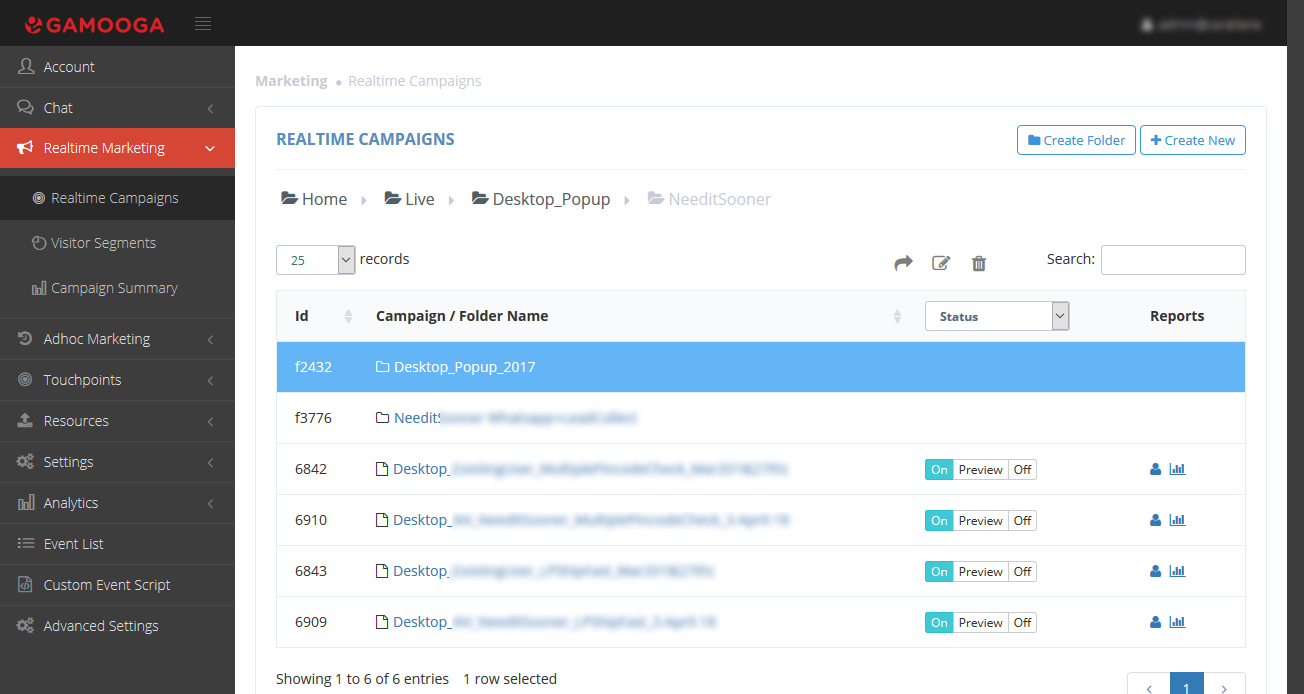
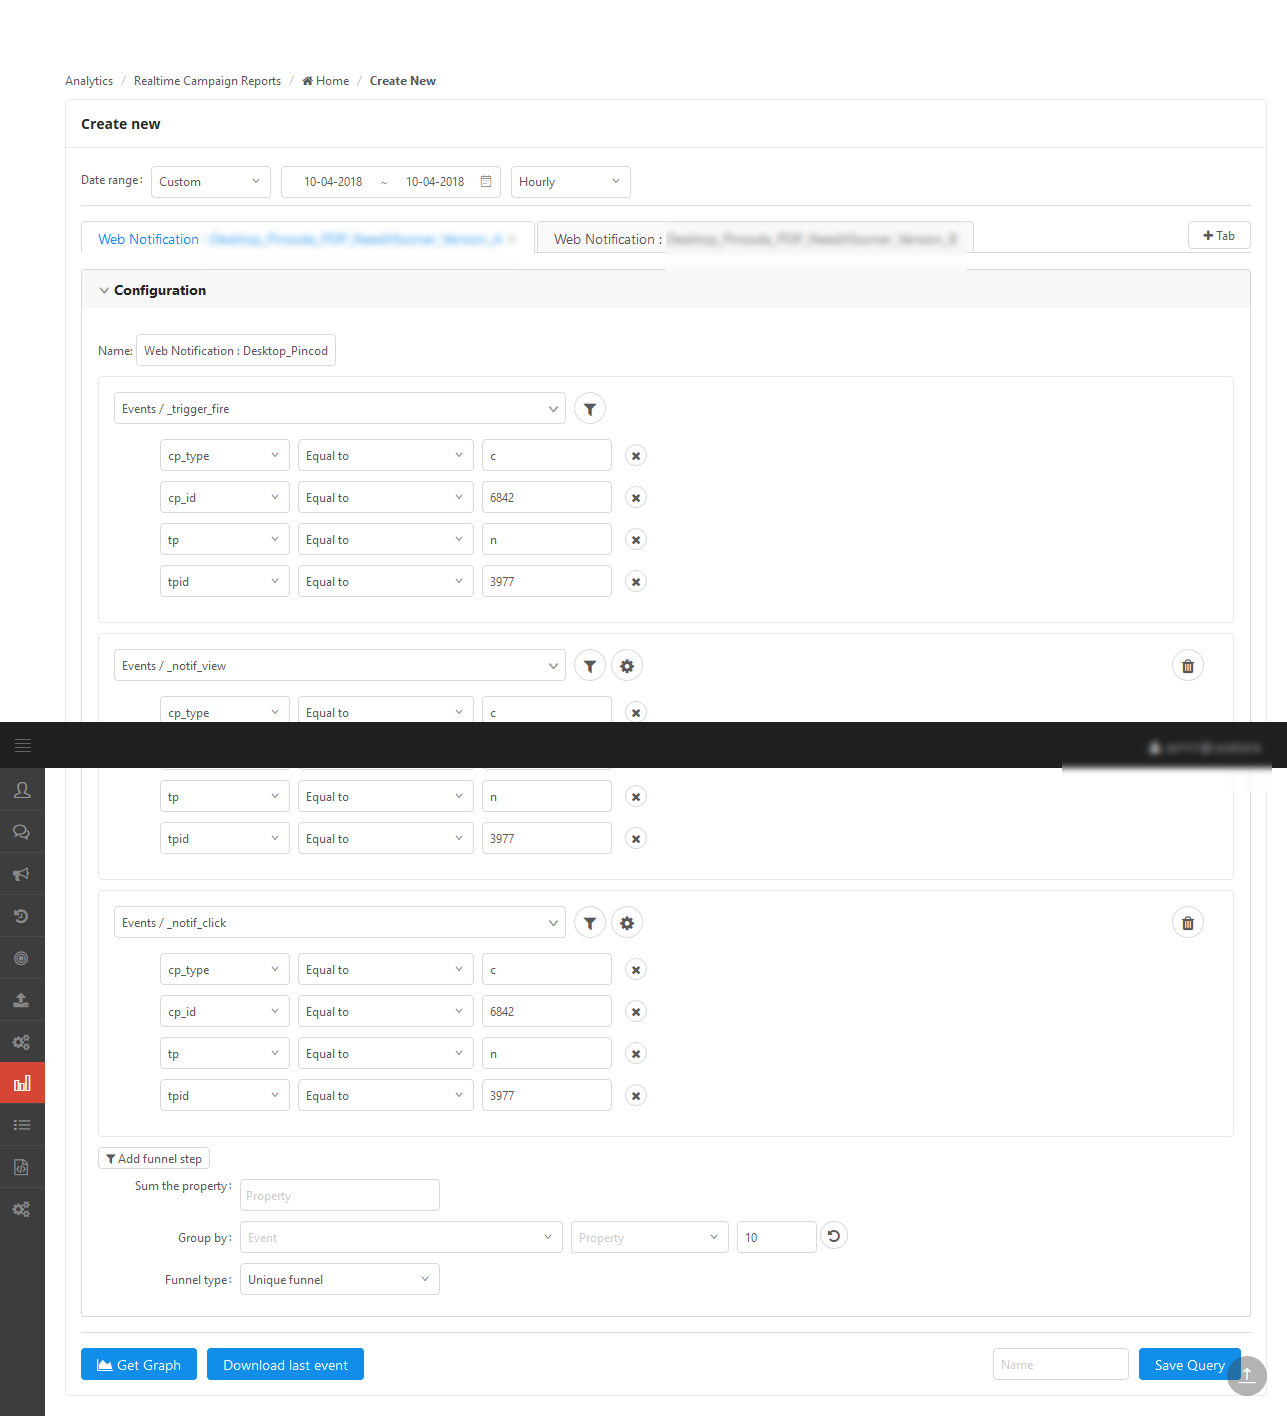
Step 1: Once the use case has been executed, we can understand how the campaign performed from the campaign reports. This can be found in the menu of the said campaign at the right corner. (Bar graph icon)
Step 2: Generating a timely graph.
After clicking on it, we can see that the required campaign performance metrics are auto-populated. We need to input the date range and timely graph for which we want to populate.
We can also select funnel type count or unique depending on the requirement.
Step 3: Getting the graph.
After clicking on “get graph”, we can see the graph populating as below.
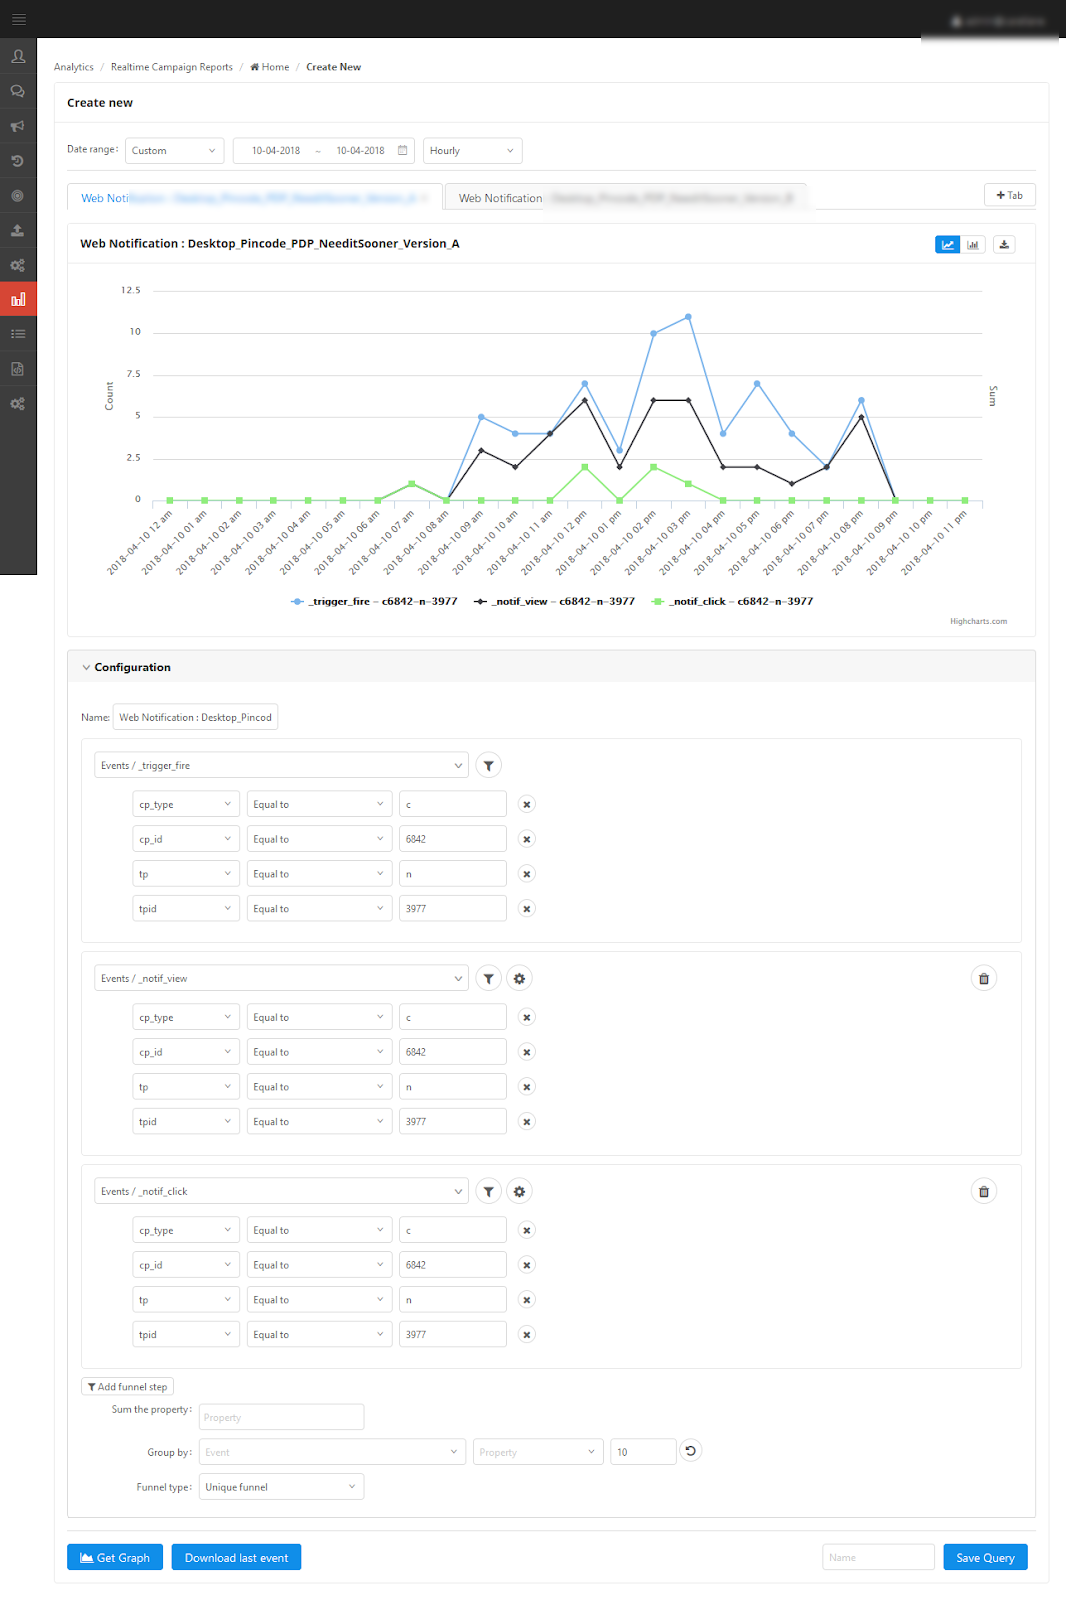
Step 4: Analysis of the data.
We can see data flow of the campaign by clicking on the bar graph icon in the top right corner of the graph. The graph below shows the data for both campaigns and interpretation can be made as per requirement of the use case.